Chris Dixon is a PhD candidate at the University of Sheffield, where he studies the language and literacy development of EAL pupils in years 4-6. In this post he shares the ‘EAL Map’ of England and Wales that he created as part of his research.

Last year a report was published which examined the educational achievement of pupils learning EAL in England (Strand et al. 2015). Using data from the National Pupil Database, it produced a map showing the proportion of pupils learning EAL in each of England’s Local Authorities in 2013. The results were striking. Nearly 54% of English primary schools had between 1 and 5% EAL enrolment, whereas at the other end of the scale, in just over 8% of schools, pupils with EAL comprised the majority of learners. One can only wonder how such a stark contrast affects the visibility of EAL in policymaking and governance.
Armed with Statistical First Release data from the DfE and somewhat shaky knowledge of freely available QGIS map-making software, I set out to produce an update. After first mapping the boundaries of each LA, I located and matched this with publicly available data giving proportions of primary school pupils with EAL across each district. After some aesthetic tinkering and assigning each LA a colour according to its proportion category, my work was done.
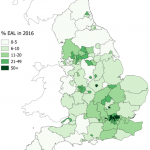
How does the EAL map look in 2016? The largest proportions of EAL learners tend to be in urban areas, while the smallest tend to be in more rural ones. In particular, areas in the North West, the Midlands, and London have schools with consistently high EAL enrolment.
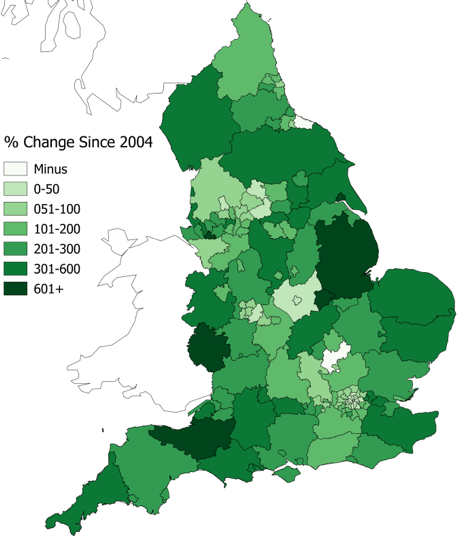
Not content with this single snapshot, I set out to look at which LAs had experienced the largest growth in proportion of EAL learners over time. Interestingly, this produces a map which is almost the inverse of the 2016 map; that is, areas with a high proportion of EAL learners today also tend to have had the smallest growth in proportion of EAL learners. Since 2004 (the earliest that the data are publicly available), the proportion of EAL learners in English primary schools in each LA grew by an average of 275%, excluding the three LAs which actually experienced negative growth. Interestingly, many more traditionally low-EAL, rural areas experienced particularly high rates of growth (e.g. Herefordshire 1147%, Lincolnshire 860%, and Somerset 814%). In conclusion, it appears that EAL learners are becoming more geographically diverse and that indeed, EAL is on its way to becoming a national issue.
The LAs with the lowest and highest proportions of primary school EAL learners:
| Lowest 5 | Highest 5 | ||
| LA | % | LA | % |
| Redcar and Cleveland | 1.2 | Tower Hamlets | 74.8 |
| Northumberland | 1.9 | Newham | 72.4 |
| Halton | 1.9 | Westminster | 68.9 |
| St. Helens | 2.4 | Brent | 68.7 |
| Durham | 2.5 | Redbridge | 65.8 |
References:
Strand, Steve, Lars Malmberg and James Hall (2015). English as an Additional Language (EAL) and educational achievement in England: An analysis of the National Pupil Database. Oxford: University of Oxford.

The EAL Journal is published termly by NALDIC, the subject association for EAL. Visit www.naldic.org.uk to become a member.


